Tag Archives: map

Understanding the cross K-function [interactive visualization]

!!!UPDATE!!!
Since this post is still getting a lot of views, some of you might be interested in the
outcomes of my experiments with the cross K-function. I used the function in 2 recent
papers. Links to the articles are found on the Publications page.

Juhász, L. and Hochmair, H. H. (2017). Where to catch ‘em all? – a geographic analysis
of Pokémon Go locations. Geo-spatial Information Science. 20 (3): pp. 241-251

Hochmair, H.H., Juhász, L., and Cvetojevic, S. (2018). Data Quality of Points of
Interest in Selected Mapping and Social Media Platforms. Kiefer P., Huang H., Van de
Weghe N., Raubal M. (Eds.) Progress in Location Based Services 2018. LBS 2018. 
Lecture Notes in Geoinformation and Cartography (pp. 293-313) Berlin: Springer.

One of the research papers I’ve submitted recently (yes, about Pokémons!) dealt with spatial point pattern analysis. Visually it seemed that two of my point sets prefer to cluster around each other, in other words I suspected that Pokéstops have a preference of being close to Pokémon Gyms. Check the map below to see what I mean. Pokémon locations (cyan dots) are all over the place as opposed to Pokéstops (orange) that almost exclusively appear to be in the proximity of gyms (red).
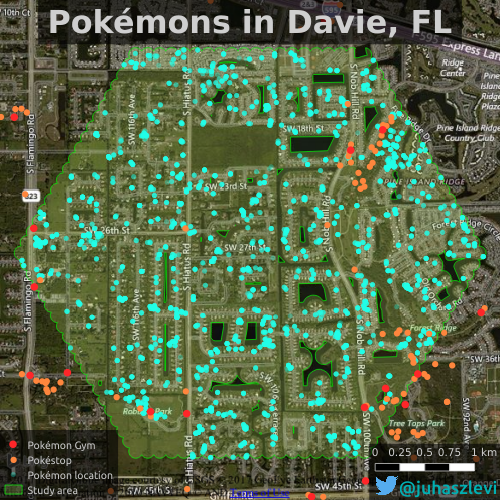
davie_poke

To confirm what’s obvious from the map, I used the bivariate version or Ripley’s K-function (a.k.a. the cross-K function) that can help us characterize two point patterns. As it turns out, it’s not as easy to interpret as I though it would be (at least with real world data) and I was trying to get my head around it for quite some time. As a result, I came up with a simple interactive visualization of this function to illustrate what it really means. If you’re anything like me and try to understand your stats instead of just reporting the results, you might want to read on more for some musings about the cross K-function.

Continue reading

More videos on cross-mapping

Oops, I forgot to share my “new” videos I made this June. Better later then never, I guess. Anyways, it’s part of my research that aims to understand how regular people on the Internet use different mapping platforms. Well, not just mapping platforms but basically any platforms that you can think of including Instagram, Foursquare, Twitter, Facebook an many more. We know that many of you use multiple services during your daily routines. Previous research focused on each of these data sources separately so we have a lot of knowledge on them (not playing the Big Brother here, I’m talking about an aggregated level). However, we do not yet know how the same individual uses these services simultaneously. Do activity spaces overlap? Is there a single main service or do people use different services with the same intensity? Does the introduction of a new service affect previous usage patterns? Can the user base from a platform drained by another? How do these processes work in time and space? Well, and I have many more questions. Probably way more questions than I can realistically answer, especially when don’t just talk about simple social media photos but really high quality mapping activities (as in editing OpenStreetMap and taking Mapillary street level photos specifically for mapping).

Nevertheless, I started working on this kind of research and made some early visualizations. Below are two videos showing how OpenStreetMap users pull images from Mapillary and edit the map based on other people’s contributions. How crazy is that? You grab one source of user generated content to improve another? Who would have thought about that 5 years ago?

The first map shows to what extent an OSM mapper loaded Mapillary photos to his editor (cyan rectangles) and showcases (with labels) whenever an editing activity based on those photos could have been identified. It means that people really check photos over an extensive area just to see if they can find some new details to add to the map. I think it’s impressive.

Read on to check another video!
Continue reading

Bulk import of Buildings in Miami-Dade

This Monday I attended my very first Maptime Miami Meetup where Matthew Toro talked about a potentially great addition to Miami’s OSM… buildings! What makes a map detailed and fancy looking? I think it’s buildings. And landuse. And POIs. Oh well, I could continue adding items to this list for days without even starting to talk about it, really. But in any case, buildings are without a doubt the very foundation of what we can call a detailed map. Sadly, Miami’s OSM is not what we can call nice and detailed in its current state. It instantly becomes clear when you look at the map that it needs some improvement. But you know what? That’s the fun part of collaborative mapping. It’s really up to us how we build a useful map database and how detailed we want it to be. It’s us, regular people who add restaurants, bike lanes, shops and many other things we care about. Long story short, the Meetup was about importing a publicly available building dataset and making it an integral part of OpenStreetMap. I’ve decided to participate in the process, and I planned to help out with some basic stuff, throwing some ideas, maybe writing some code. You know, nothing fancy. At least that’s what I imagined. But as things rarely turn out the way we want them, now I’m the tech lead on this. Big words, I know, but they’re not mine.

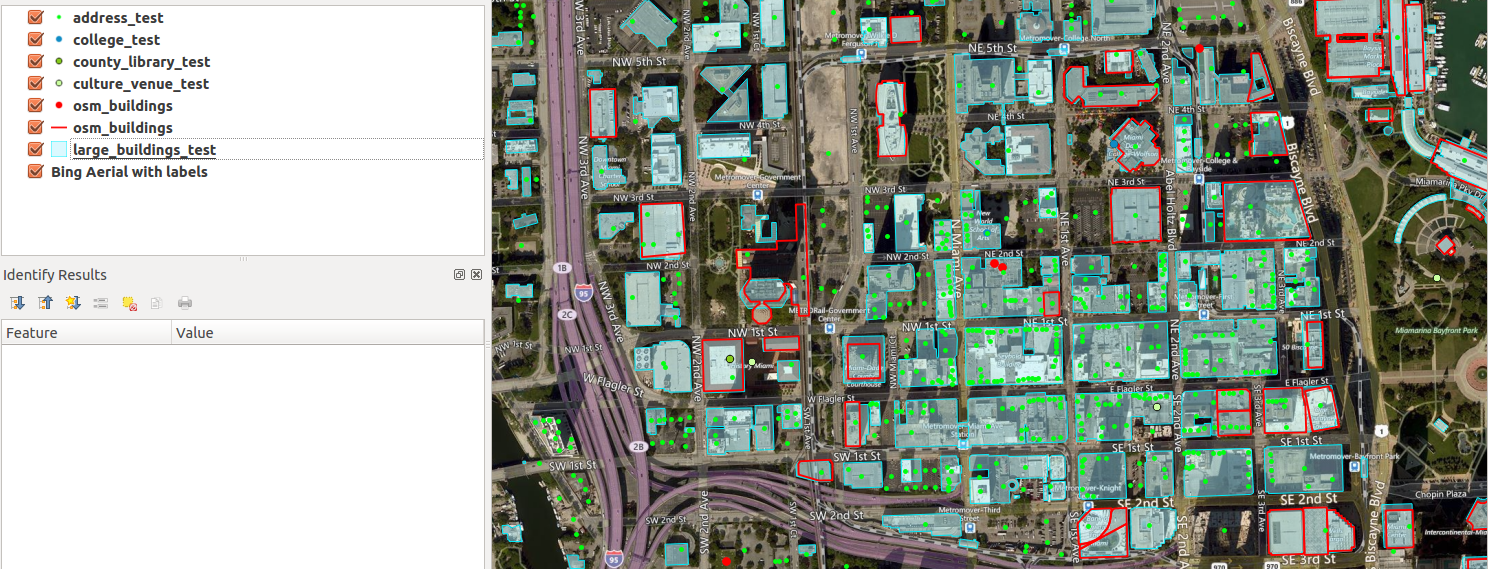
downtownMIA

Red outline: current OSM buildings. Cyan spots: buildings to be imported. Now, that’s a lot of new buildings to add!

Continue reading

Hey, do you even map bro?

A year ago, high quality aerial imagery with a 10cm ground resolution was made available to the OSM community in Szeged, Hungary. It’s a very good example of not just sitting on the data but trying to make use of it. In theory, OpenStreetMap community can absolutely benefit from having a data source like this as there are way more details to be derived from such high resolution imagery. Also, the positional accuracy of the orthophoto is worth mentioning. You know, this is the kind of aerial photograph that you can make measurements on, like if it was a true map. It’s important because you can skip playing with different offsets and dragging your base map around to make it appear in its “true” position before you can actually start mapping. So, truth’s been told. It’s cool, but what the heck is with it?

Well, It’s been a year or so. I can talk about the benefits for days but it doesn’t really matter if no one is acting accordingly, right? There are things that “should” work in theory but when it comes to online communities… well, that’ a whole different story. Anyway, let’s lurk around and see what awesome mappers of OSM think about all this (oh, did I just say awesome people of OSM? Is it a spoiler? Oh well, I guess you have to click on the link below and read more to figure it out.)

szeged_orto_cover

Continue reading

Twitter data analysis from MongoDB – part 3, Basic spatial and temporal content

In the previous posts I have introduced the topic and did some simple coding to explore the data. That’s not bad at all but usually the goal is to create something new or at least to understand what is going on. In this simple example we’re interested in the weather. We want to see what people tweeted about the weather during the data collection period. Unfortunately, a dataset of 200.000 tweets is not big enough to recreate the weather conditions for that time. Why? Simply because after getting rid of the unrelated tweets we have almost nothing to deal with. If you’re here because you’re interested in the past weather of the UK, I think you should better visit this site :). For the others, I promise I’m going to tell you how I created some maps.

Twitter-hava-durumuimage by Havadurumu

Continue reading

Mapillary vs StreetView coverage

I’ve recently found Mapillary which is a great project that aims to cover the world with street level photos, just like Google’s StreetView. The big difference is that they use the crowdsourcing approach and collect images from volunteers, mostly equipped with smartphones or action cameras. All photos are available under CC BY-SA 4.0. They process all uploaded photos using computer vision on their servers. They have a nice API so everything is given. They’re open, they’re geospatial and they’re nice. You can talk with them via Twitter or email. They’ll respond. Currently, you can find them in Malmö, Sweden and in West Hollywood, Los Angeles. The project pretty soon has gone worldwide. The service was initially released in the last week of February 2014 at the Launch Festival and  since then they cover 101658370 meters with 3541820 uploaded photos until September 21.  Check out their site and see what they are doing. From my sight, it’s pretty impressive. I’ve shot this panorama view in Key West, FL.


Continue reading