Tag Archives: postgresql

Radius of Gyration

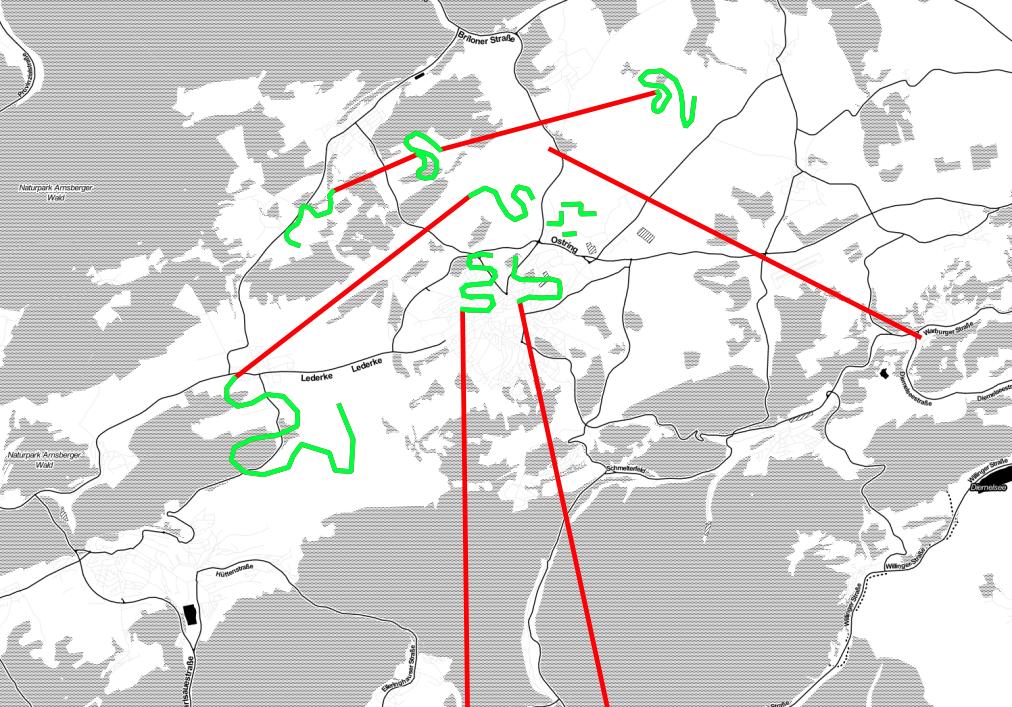
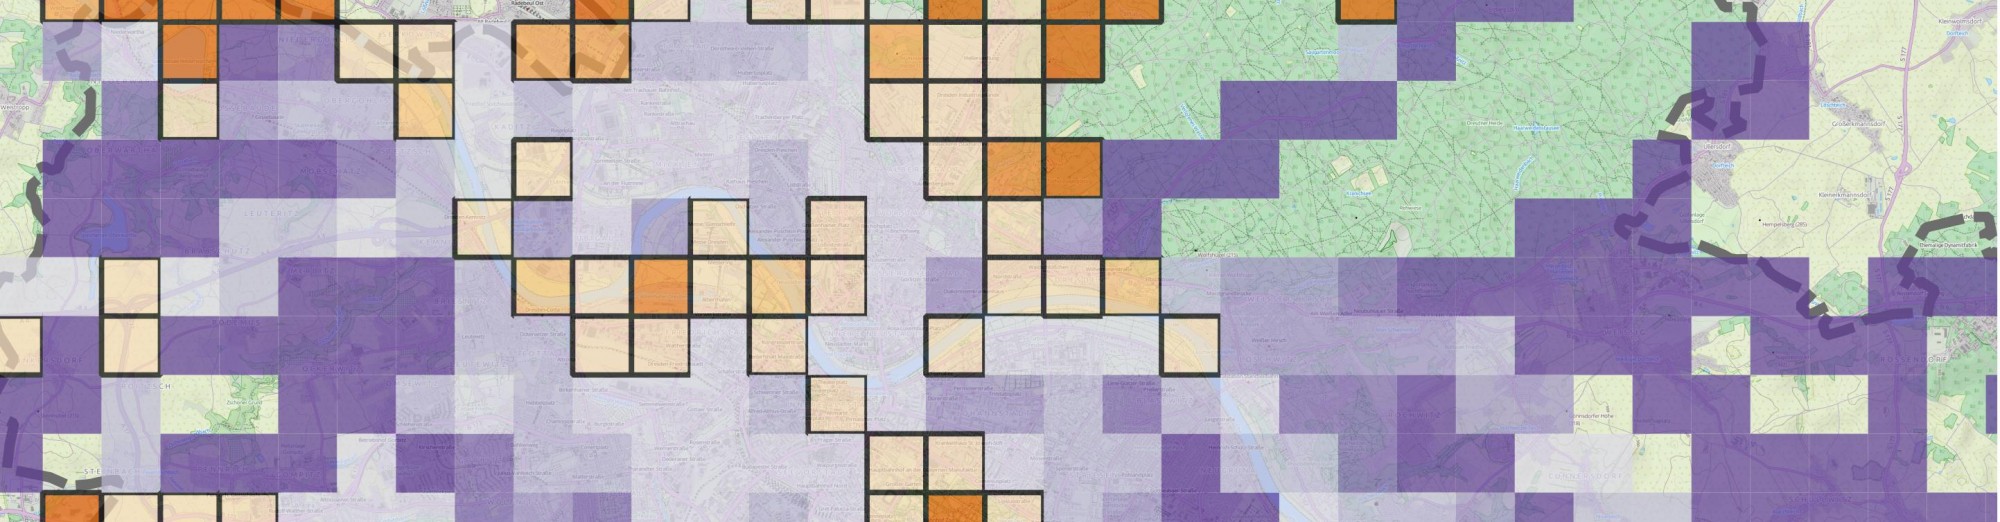
Radius of gyration is a metric to quantify distributions around a center location. Its applications range from structural engineering to molecular physics. Since it incorporates the idea of dealing with locations, it can be applied for geographic data, as well. I recently came across with it in some global mobility studies where the goal was to characterize the travel patterns of individuals. In those papers, the metric indicates whether a person is more likely to travel long distances or not. In my research, where I am interested in geographic data contributions of volunteer mappers, I found it to be extremely useful to decide if the overall contribution shows local or global patterns. For many years, local knowledge was considered to be the main advantage of this so-called user generated geographic information. Local guys know the place, let them draw maps, let them take photos and the product will be accurate. While this is most probably true, it also seems that some of these guys like to do the same thing in distant places so there might be other factors than localness that can make these data sources accurate, therefore extremely valuable. Everything is up to the people who contribute, so the ultimate goal is still to understand their behavior. Now, enough of the crazy talk. Click on “read more” to do some fancy math and coding.

Continue reading

Breaking lines at long segments

I wanted to get rid of long line segments in my data. Since I don’t know any software tools off the top of my head that would do the job, I decided to code it myself. I have already stored everything in a spatially-enabled PostgreSQL table, and to be honest, recently I am more interested in manipulating data at the database level to save some time. So, instead of writing a python script and looping through a cursor, I created a function which I am calling in SQL queries. The picture below gives an overview of what the following function does. Basically, it breaks input geometries at line segments that exceed a certain threshold in length. Red means “no bueno”, green means “yaay!”.

1

Continue reading

MongoDB – PostgreSQL speed comparison

As the last part of the previous post-series about MongoDB and Twitter I’m about to show some plots about an initial speed comparison of the two DBs. As a result, these plots show how MongoDB can perform better than traditional SQL solutions if it comes to speed. Of course the overall picture is more sophisticated. In these cases I focused on the simplest approach possible – retrieving documents from Mongo and rows from Postgre.

time

Continue reading

Twitter data analysis from MongoDB – part 1, Introduction

Twitter, MongoDB and PostgreSQL are fun. Let’s put all together and see what we can do. Twitter is an evolving platform for many kinds of analyses. Anyone can access to the content and can be a data scientist for a while. If you’d like to play Big Brother just go ahead and start playing with it and you’ll find a lot of interesting things from people all over the world. Some says that NoSQL databases (such as MongoDB) are perfect for storing Big Data due its scalability and non-relational nature. The good thing in not being a computer scientist is that I can test them as an outsider – without knowing what I am really doing :).

twitter_img

A little background: a few months before I had access to a database of approx. 200.000 tweets. It’s really nothing compared to some other databases but still big enough for retrieving data to be time-consuming. I was not responsible for the data collection but all data were coming from the Twitter Streaming API and my colleagues stored them both in a MongoDB collection and in a PostgreSQL table. They used the API’s location parameters for requesting data from an area located in the Southern part of the UK. Retrieving geographic data from PostgreSQL (with postgis) is relatively easy and well known but what about MongoDB? Can we even do it? I had no idea but it seemed to be fun enough to explore it. In these posts (maybe there will be 3 or so) I’ll show you how I visualized them. I’ll write about how I tried to extract some weather related information from them (come on, it’s the UK so I thought everyone tweets about the weather!) and lastly, I will show you how I tried to compare the two database engines in terms of speed.

Continue reading