This video was presented at the closing plenary of the FOSS4G 2014. I have no words… pretty awesome! I wasn’t even born yet. Wow, seriously, no words… Enjoy.
Author Archives: jlevente
Twitter data analysis from MongoDB – part 4, Visualizing Tweets
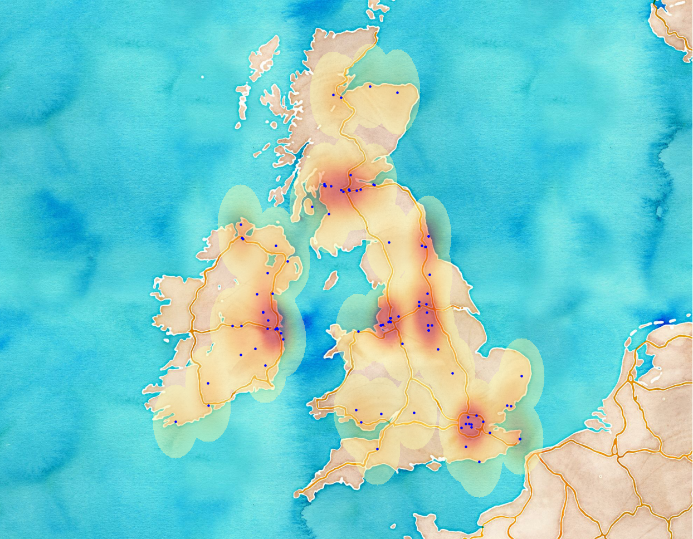
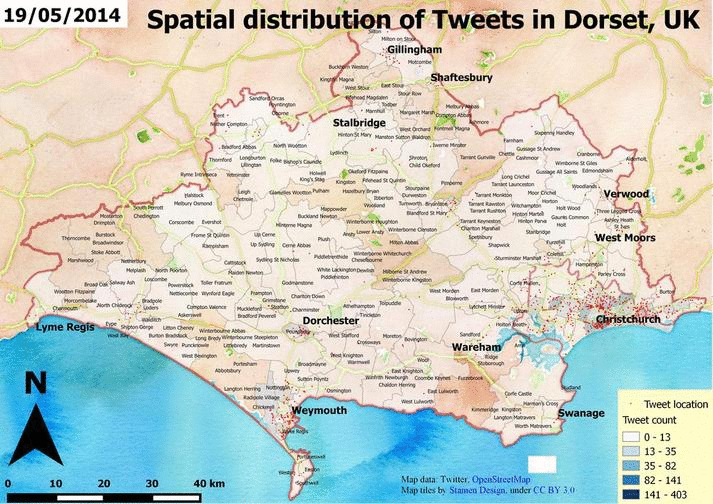
Originally I wanted to write about visualization in the 2nd post (and after that in the 3rd) but that post would have been too long to read. I always loose myself if it comes to writing but nevermind, finally it’s here. So, we know how to access to the DB and we can query for interesting subsets – even in a geographic way. All we have to do is to interpret our results. I’m presenting two ways, a gif animation and a wordcloud. It’s not about reinventing the wheel but still, I believe that these are useful approaches to complement each other.
Twitter data analysis from MongoDB – part 3, Basic spatial and temporal content
In the previous posts I have introduced the topic and did some simple coding to explore the data. That’s not bad at all but usually the goal is to create something new or at least to understand what is going on. In this simple example we’re interested in the weather. We want to see what people tweeted about the weather during the data collection period. Unfortunately, a dataset of 200.000 tweets is not big enough to recreate the weather conditions for that time. Why? Simply because after getting rid of the unrelated tweets we have almost nothing to deal with. If you’re here because you’re interested in the past weather of the UK, I think you should better visit this site :). For the others, I promise I’m going to tell you how I created some maps.
 image by Havadurumu
Mapillary vs StreetView coverage
I’ve recently found Mapillary which is a great project that aims to cover the world with street level photos, just like Google’s StreetView. The big difference is that they use the crowdsourcing approach and collect images from volunteers, mostly equipped with smartphones or action cameras. All photos are available under CC BY-SA 4.0. They process all uploaded photos using computer vision on their servers. They have a nice API so everything is given. They’re open, they’re geospatial and they’re nice. You can talk with them via Twitter or email. They’ll respond. Currently, you can find them in Malmö, Sweden and in West Hollywood, Los Angeles. The project pretty soon has gone worldwide. The service was initially released in the last week of February 2014 at the Launch Festival and since then they cover 101658370 meters with 3541820 uploaded photos until September 21. Check out their site and see what they are doing. From my sight, it’s pretty impressive. I’ve shot this panorama view in Key West, FL.
Twitter data analysis from MongoDB – part 2, Exploring data
In the previous post, I’ve introduced the topic and technology. Now, it’s time to define the problem and methods. Next entries will discuss how to access to MongoDB and how to retrieve geocoded Tweets. I will focus on tweets that are somehow related to the weather using the simplest approach possible – querying their content for the keyword ‘weather’. I will create some nice visualizations later on, an animated gif and a wordcloud that can help us understand what is behind the scenes. You’ll find some code snippets and screenshots so feel free to scroll down to those if you’re not interested in long discussions. So, let’s grab the data from MongoDB and see what’s inside! There’s quite much to do.
Twitter data analysis from MongoDB – part 1, Introduction
Twitter, MongoDB and PostgreSQL are fun. Let’s put all together and see what we can do. Twitter is an evolving platform for many kinds of analyses. Anyone can access to the content and can be a data scientist for a while. If you’d like to play Big Brother just go ahead and start playing with it and you’ll find a lot of interesting things from people all over the world. Some says that NoSQL databases (such as MongoDB) are perfect for storing Big Data due its scalability and non-relational nature. The good thing in not being a computer scientist is that I can test them as an outsider – without knowing what I am really doing :).
A little background: a few months before I had access to a database of approx. 200.000 tweets. It’s really nothing compared to some other databases but still big enough for retrieving data to be time-consuming. I was not responsible for the data collection but all data were coming from the Twitter Streaming API and my colleagues stored them both in a MongoDB collection and in a PostgreSQL table. They used the API’s location parameters for requesting data from an area located in the Southern part of the UK. Retrieving geographic data from PostgreSQL (with postgis) is relatively easy and well known but what about MongoDB? Can we even do it? I had no idea but it seemed to be fun enough to explore it. In these posts (maybe there will be 3 or so) I’ll show you how I visualized them. I’ll write about how I tried to extract some weather related information from them (come on, it’s the UK so I thought everyone tweets about the weather!) and lastly, I will show you how I tried to compare the two database engines in terms of speed.
First off
During the past few months some people told me that I should start blogging about my experiments. Actually, this idea was always in the air but I guess I just never made a lot of effort to think about it seriously. I always got stuck in the very beginning so I haven’t even chose a name for it, not to mention writing posts. Anyway, who the hell is curious about what I think or do? – I always thought. Now, it seems like some people are. Let me briefly explain what one can expect from me.


