Author Archives: jlevente

Bulk import of Buildings in Miami-Dade

This Monday I attended my very first Maptime Miami Meetup where Matthew Toro talked about a potentially great addition to Miami’s OSM… buildings! What makes a map detailed and fancy looking? I think it’s buildings. And landuse. And POIs. Oh well, I could continue adding items to this list for days without even starting to talk about it, really. But in any case, buildings are without a doubt the very foundation of what we can call a detailed map. Sadly, Miami’s OSM is not what we can call nice and detailed in its current state. It instantly becomes clear when you look at the map that it needs some improvement. But you know what? That’s the fun part of collaborative mapping. It’s really up to us how we build a useful map database and how detailed we want it to be. It’s us, regular people who add restaurants, bike lanes, shops and many other things we care about. Long story short, the Meetup was about importing a publicly available building dataset and making it an integral part of OpenStreetMap. I’ve decided to participate in the process, and I planned to help out with some basic stuff, throwing some ideas, maybe writing some code. You know, nothing fancy. At least that’s what I imagined. But as things rarely turn out the way we want them, now I’m the tech lead on this. Big words, I know, but they’re not mine.

downtownMIA

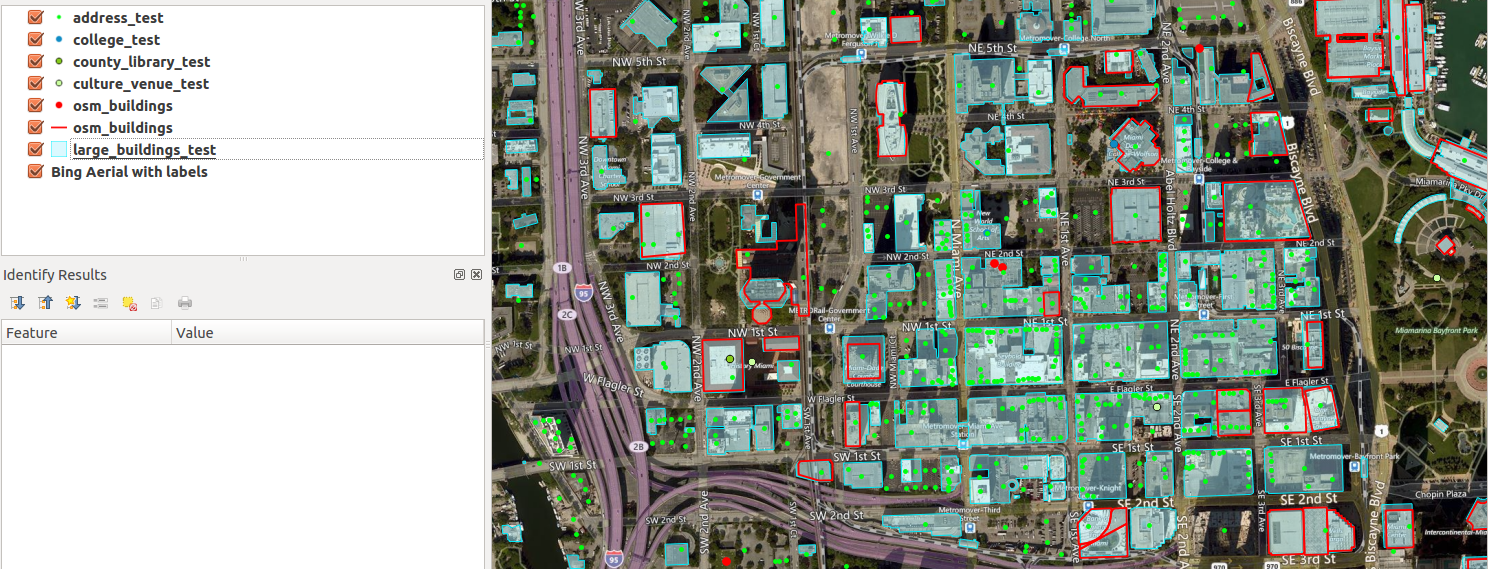
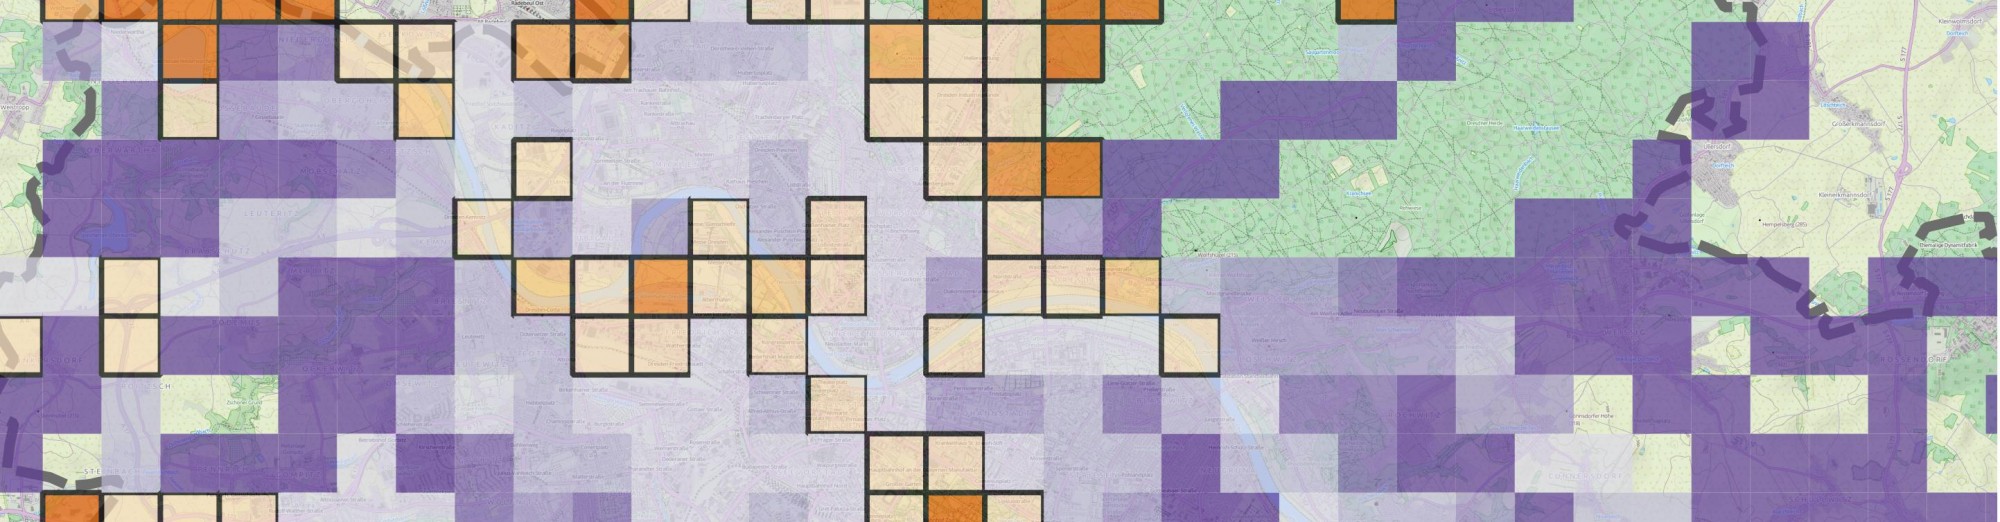
Red outline: current OSM buildings. Cyan spots: buildings to be imported. Now, that’s a lot of new buildings to add!

Continue reading

Next Generation Data Management in Movement Ecology

**UPDATE: presentation can be found here.**

In case you haven’t made your summer vacation plans yet, I happen to be a guest lecturer for this intensive summer workshop/course. It’s mainly designed for wildlife ecologists so you might wonder what I’ll be doing there. Well, wherever spatial data is involved, I’m there!

While I surely won’t be the person providing ecological context, hopefully my participation will provide some different insights to the world of  geographic data handling with spatial databases. I’ll try my best and come up with an interesting lecture about the possibilities of PostGIS in spatial data handling. You know, all the cool stuff. Buckle up, it will be an interesting course that is extremely useful for ecologists. Hoping to see you there!

Continue reading

Animated maps for Saturday

How long does it take to map an area with Mapillary? Well, apparently it’s up to you. According to he video below, it shouldn’t take long. It shows how street level photo coverage evolved in Phoenix, AZ between June 2015 and April 2016. I’m always amazed to see what can be achieved in just less than a year.

Videos were generated using the Time manager plugin of QGIS and Libav.

Hey, do you even map bro?

A year ago, high quality aerial imagery with a 10cm ground resolution was made available to the OSM community in Szeged, Hungary. It’s a very good example of not just sitting on the data but trying to make use of it. In theory, OpenStreetMap community can absolutely benefit from having a data source like this as there are way more details to be derived from such high resolution imagery. Also, the positional accuracy of the orthophoto is worth mentioning. You know, this is the kind of aerial photograph that you can make measurements on, like if it was a true map. It’s important because you can skip playing with different offsets and dragging your base map around to make it appear in its “true” position before you can actually start mapping. So, truth’s been told. It’s cool, but what the heck is with it?

Well, It’s been a year or so. I can talk about the benefits for days but it doesn’t really matter if no one is acting accordingly, right? There are things that “should” work in theory but when it comes to online communities… well, that’ a whole different story. Anyway, let’s lurk around and see what awesome mappers of OSM think about all this (oh, did I just say awesome people of OSM? Is it a spoiler? Oh well, I guess you have to click on the link below and read more to figure it out.)

szeged_orto_cover

Continue reading

Radius of Gyration

Radius of gyration is a metric to quantify distributions around a center location. Its applications range from structural engineering to molecular physics. Since it incorporates the idea of dealing with locations, it can be applied for geographic data, as well. I recently came across with it in some global mobility studies where the goal was to characterize the travel patterns of individuals. In those papers, the metric indicates whether a person is more likely to travel long distances or not. In my research, where I am interested in geographic data contributions of volunteer mappers, I found it to be extremely useful to decide if the overall contribution shows local or global patterns. For many years, local knowledge was considered to be the main advantage of this so-called user generated geographic information. Local guys know the place, let them draw maps, let them take photos and the product will be accurate. While this is most probably true, it also seems that some of these guys like to do the same thing in distant places so there might be other factors than localness that can make these data sources accurate, therefore extremely valuable. Everything is up to the people who contribute, so the ultimate goal is still to understand their behavior. Now, enough of the crazy talk. Click on “read more” to do some fancy math and coding.

Continue reading

Releasing high resolution aerial imagery to OSM in Szeged, Hungary

In my spare time, I teamed up with my old colleagues, the lovely faculty members at the University of Szeged, Department of Physical Geography and Geoinformatics to ask them for data donation. I couldn’t be happier to announce that after months of procrastination, some other delays and some more months of procrastination on my side, finally I am able to release a high resolution aerial imagery to the OpenStreetMap community for the solely purpose of mapping.

Szeged_orto

Continue reading

Szegedi 2011-es nagyfelbontású légifotó és az OSM

Végre sikerült összehozni egy régi tervemet. Nagy örömömre szolgál bejelenteni, hogy a Szegedi Tudományegyetem Természeti Földrajzi és Geoinformatikai Tanszéke jóvoltából az OpenStreetMap közösség szabadon felhasználhatja a Szeged körtöltésen belüli részéről 2011-ben készült, nagy felbontású ortofotó állományt térképszerkesztés céljából.

Szeged_orto

Continue reading

Breaking lines at long segments

I wanted to get rid of long line segments in my data. Since I don’t know any software tools off the top of my head that would do the job, I decided to code it myself. I have already stored everything in a spatially-enabled PostgreSQL table, and to be honest, recently I am more interested in manipulating data at the database level to save some time. So, instead of writing a python script and looping through a cursor, I created a function which I am calling in SQL queries. The picture below gives an overview of what the following function does. Basically, it breaks input geometries at line segments that exceed a certain threshold in length. Red means “no bueno”, green means “yaay!”.

1

Continue reading

The Book of OSM

Today, a new project appeared on Kickstarter from the founder of OpenStreetMap, Steve Coast. I highly encourage everyone (in case you can) to stand for it so we can enjoy some insights about OSM.  It’s pretty interesting how more than 1/5 of the goal have been pledged in less then 1 day.

In addition, enjoy a recent talk about the project.


MongoDB – PostgreSQL speed comparison

As the last part of the previous post-series about MongoDB and Twitter I’m about to show some plots about an initial speed comparison of the two DBs. As a result, these plots show how MongoDB can perform better than traditional SQL solutions if it comes to speed. Of course the overall picture is more sophisticated. In these cases I focused on the simplest approach possible – retrieving documents from Mongo and rows from Postgre.

time

Continue reading