In the previous posts I have introduced the topic and did some simple coding to explore the data. That’s not bad at all but usually the goal is to create something new or at least to understand what is going on. In this simple example we’re interested in the weather. We want to see what people tweeted about the weather during the data collection period. Unfortunately, a dataset of 200.000 tweets is not big enough to recreate the weather conditions for that time. Why? Simply because after getting rid of the unrelated tweets we have almost nothing to deal with. If you’re here because you’re interested in the past weather of the UK, I think you should better visit this site :). For the others, I promise I’m going to tell you how I created some maps.
 image by Havadurumu
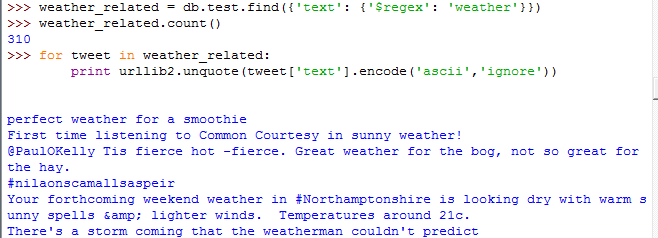
Let’s query the collection for the tweets that contain the keyword weather for further use. We will pass a python dict to the find() method in which we ask the server for matching the ‘text’ property of each document to a regular expression. Iterating through the cursor and printing out the tweets can give us a sense of what people were talking about.
 Just take a closer look at the 3rd line. It says there are only 310 tweets in the collection that contain the the word ‘weather’. Anyway, we can access to any properties (key-value pairs) of the weather related tweets so the gates are open. Printing out is just the simplest example but the only limit is our imagination. On the other hand, sometimes our dataset can limit us as well. Like in this case. Although it would be possible to plot the frequencies day by day, the resulting plot wouldn’t be too informative due to the lack of data. Believe me, I tried it so I’ll just skip that part and show something else.
Spatial content
I’m keep taking about how important geography and spatial information are but haven’t show you any of it. OK, I mentioned that tweets can contain coordinates but come on! As long as I just keep inserting these stupid code snippets you won’t believe me and that’s how things should be. Let’s ask some questions instead and see if we can answer them:
Is MongoDB capable to store geographic information? Can we visualize the content in a map? Can we perform spatial operations in the database level?
Note that these questions are generic. You should be aware of using MongoDB as a backend of all kind of spatial information and for all kind of purpose. I’m not saying that MongoDB and NoSQL solutions are best for this task because they are not. At least not necessarily. All I want to communicate is that these NoSQL solutions has some geo-capabilities and in some cases using them would be beneficial – in terms of speed or scalability. Investigate, test, explore and if Mongo does the job you want, use it. It can happen. You’ll see that we can export the data from Mongo to any GIS software. So, let’s do this. Inspired by this post, I have created a script called ‘mongodb2geojson’ which can load the content of a mongo collection into a GeoJSON file so we can process it later. Let me know if you’re interested in using the script and I’ll make it available somewhere.
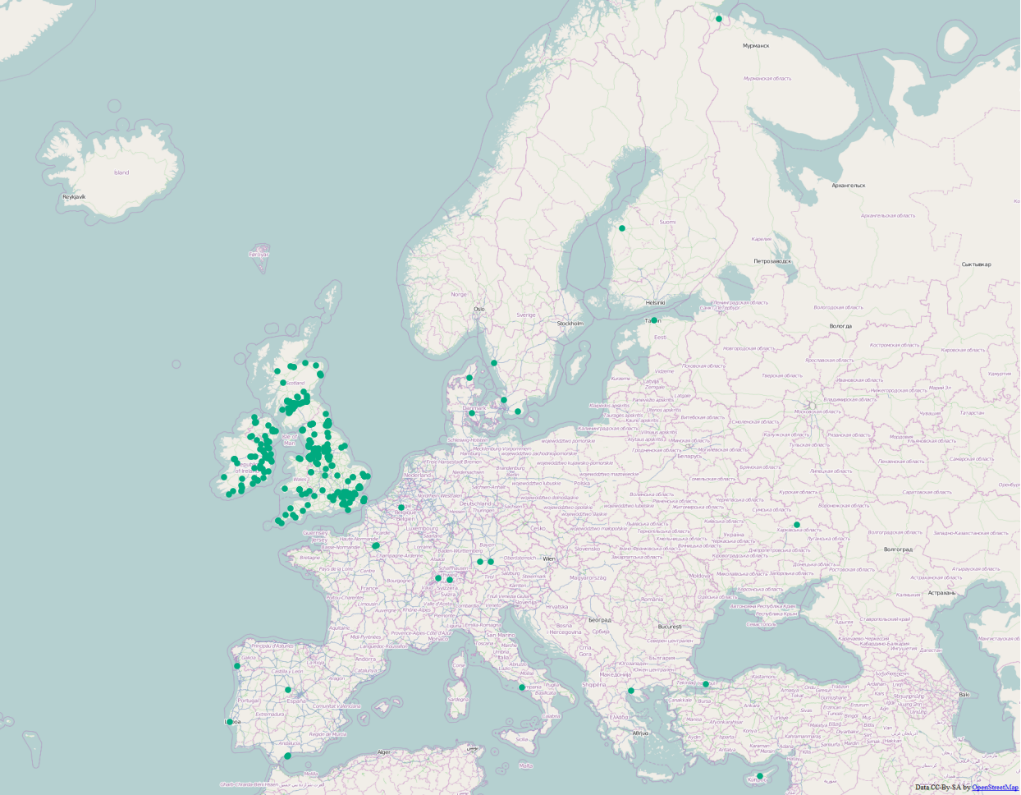
 The script took the same query expression and exported all the weather related tweets. Some document in the collection did not contain valid coordinates, that’s why we got 15 tweets less than was shown on the previous picture. At this point, we have a valid geojson file with 295 tweets out of 200.000 that can be considered weather-related. Their distribution looks like this:
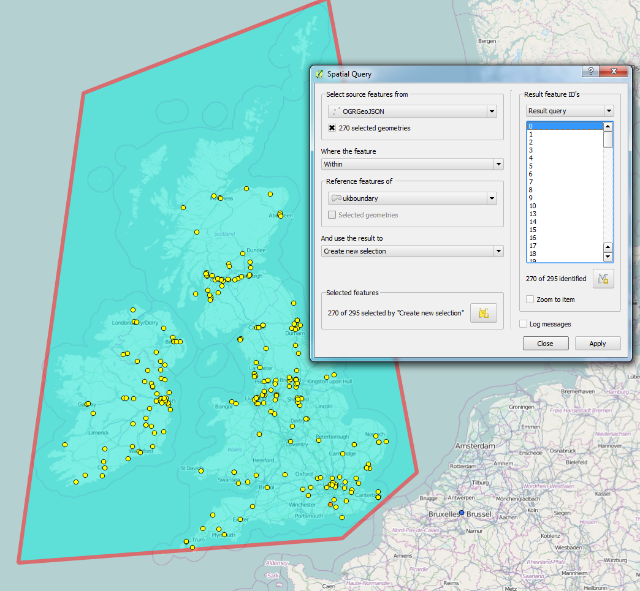
 That’s cool but I said we’re dealing with tweets from the UK but some of our points fall outside of that area. Streaming API’s location parameter was set and still, these kind of ‘errors’ happen. No problem, we can handle this. Luckily, it’s a simple GIS problem. We can use the Spatial Query Plugin of QGIS (or any other tools). If we digitize a polygon and make the comparison, it’ll say 270 of 295 points are inside the UK (and Ireland for simplicity).
 Just save this boundary as GeoJSON because we we’ll do the same spatial query in the database level to compare the results. (for example Save As… geojson in QGIS. Not too complicated, is it?). Mine looks like this:
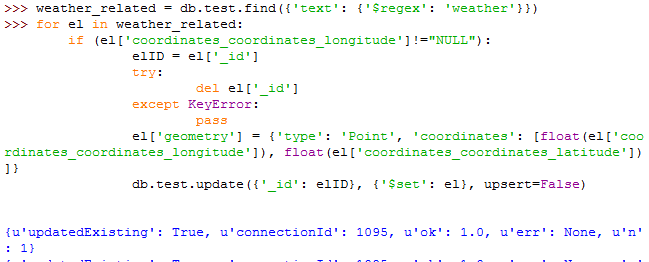
 In order to do the same trick with mongo we have to build geometry. Now, we only have separate keys that store latitude and longitude coordinates. MongoDB can store geospatial features as a GeoJSON document within documents but we have to create them first. What we are going to do is to iterate through our weather related tweets, and if a document contains geographic information, we’ll build these GeoJSON objects. Build geometry for the whole dataset is the same.
 We looped through the cursor, built the geometry, and updated the document with the update() method. Now, we are able to create a geospatial index. I have chosen a 2d spherical index which supports distance measurements in an earth-like surface (defaults to the WGS84 datum and spheroid).
![]()
Once we have geometry and a spatial index we are able to query the geographical content of tweets. Let’s do the same spatial query. We want all the documents within that boundary. At first, we must have that boundary as a GeoJSON, so we open the exported boundary file (the one that we’ve saved after running the Spatial Query Plugin) in Python and store it as a dictionary. After that we pass a spatial query ($geoWithin) operator to the find() method. The query expression gives back the tweets that contain the word ‘weather’ in the text field and that are within the given boundary. Performance is much better than the spatial query plugin of QGIS. It will probably suits for millions of tweets within an acceptable time frame. We got all the 270 documents out of the 200.000 almost immediately so the results seems to be correct.
 These are the simplest methods to use MongoDB for storing geographic data. Its geo-capabilities are not comparable to PostgreSQL’s postgis yet but still enough for doing simple stuff so feel free to experiment.
Temporal content
It is also interesting to figure out what is the temporal extent of our data. In other words, we would like to know when were the first and last relevant tweet created. This information is important to know in order to visualize the temporal distribution besides from spatial distribution. Although several ways exist in Mongo to access the details (e.g. aggregation of the collection), the simplest (and also the fastest in my opinion) is to sort the cursor in an ascending or descending order, limit the result to 1, and print out the desired field.
As you can see, we can store geographic features in MongoDB, we can perform some geospatial operations and exporting it to a common GIS format is possible. In the next part, I’ll write about creating gif animations and wordclouds as more advanced visualization methods.


I really interested in your code ‘mongodb2geojson’ I need the same idea in my college project. Can you please provide me with this code?
Oh, I’m so sorry. Did not see the notification. I can send it in case you still need it.
Hi, here is another interested developer. I’m not so proficient in Python, so I’d love to see your mongodb2geojson method!
An answer from an expert! Thanks for coiginbutrnt.
You’ve really impressed me with that answer!